CAGR meaning and calculation

CAGR or Compounded Annual Growth Rate refers to the mean annual growth over given period of time. To simply put, it shows the average annual return generated over a period of time thereby smoothing out any spikes or drops from the return over a period.

Let's take an example - you invested in a stock "A" at the beginning of year 2019 at Rs 1,000 and at end of year 2020 it's trading at Rs 500 and now at the end of 2021 its trading at Rs 3,000. How do you compute your average annual return? This is wherein CAGR comes to play, helping you smooth out the fluctuation to show your average return over 2019 to 2021.

How to calculate CAGR?

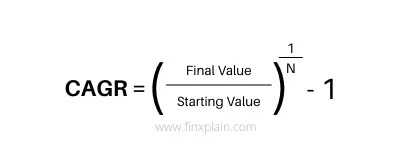
CAGR Formula
CAGR can be computed using above formula where in N refers to the number of years. Going back to our previous example, number of year would mean 2 years (2019 starting to 2021 end), Starting Value will be Rs 1,000 and Final Value will be Rs 3,000. Once calculated, you will get return of ~73.2%.

Calculating CAGR using EXCEL - 

You can use Excel's inbuilt formula of RRI. It has three arguments (number of years NPER, present value PV and final value FV).

So to calculate our example, your formula would be =RRI(2,1000,3000)

Always remember, while comparing CAGR between two stocks / investment / any item; numbers of years are equal. Else, you will be comparing apple to oranges.

Comments

Popular posts from this blog

Growth Calculation with negative numbers

Once in a while, you face a situation wherein growth % is to be calculated – where one of the number is negative. Here’s quick approach and my thoughts. Ideal approach used to calculate the growth is  Approach 1: (Current Number / Old Number) -1 Few people follow the approach of differential, like Approach 2: (Current Number – Old Number) / Old Number Both are good to use as long as both the numbers are positive. Let’s take a quick example:  Scenario 1:  Say Previous quarter profit was at 100 and current quarter profit is at 120 – growth in profit would be calculated at 20% using either of the formula. Approach 1: (Current Number / Old Number) -1 = (120 / 100) -1 = 0.2 or 20% Approach 2: (Current Number – Old Number) / Old Number = (120 – 100)/100 = 0.2 or 20% Scenario 2: Assume that current quarter there is a loss of 20 and previous quarter was profit of 100, in this case outcome would be as follows: Approach 1: (Current Number / Old Number) -1 = (-20 / 100) -1 = -1.2 or -120% Appro

The Fisher-Graham Investing Debate: Quality vs. Value

Warren Buffet's comment about his investment strategy is one that most people involved in the stock market have read at least once... "I’m 15 percent Fisher and 85 percent Benjamin Graham". Here's an attempt to help newcomers grasp what's being said. Philip Fisher approach was qualitative understanding of the business and it's management while Ben Graham taught quantitative understanding of price and value. Qualitative Understanding of the Business and its Management (Philip Fisher's Approach): Business Analysis: This involves thoroughly researching and understanding the company's core business operations. Philip Fisher emphasized the importance of gaining insights into how a company operates, its industry dynamics, competitive advantages, and growth prospects. Management Assessment: Fisher believed that the quality of a company's management team was crucial to its long-term success. Investors should evaluate the competence, integrity, and visi

Decoding Technical Recessions: What They Mean for the Economy in Simple Terms

With news around Germany sliding into a Technical recession, here's basic explainer. Introduction: Economics can be full of complex terms and ideas that may sound intimidating, but they have a big impact on our daily lives. One such term is a "technical recession." In this blog post, let's break down what technical recessions are, what they mean for the economy, and how they affect us in simpler words. What is a Technical Recession? A technical recession happens when the economy of a country goes through a decline for six months in a row. It means that the total value of goods and services produced within the country (Gross Domestic Product or GDP) has shrunk for two consecutive quarters. This shrinkage indicates a decrease in economic activity and overall production. The Implications: A technical recession has several effects on both individuals and the economy as a whole. Firstly, people tend to spend less money during a recession. We become more careful with our fi